Inspect Turbine Application Logs in the Meroxa Dashboard
This is a legacy platform changelog. The information reflected here may not represent current functionality and some links may be broken.
We’re thrilled to announce the new application logs page in the Meroxa Dashboard, allowing you to monitor and debug your Turbine applications directly from the browser.
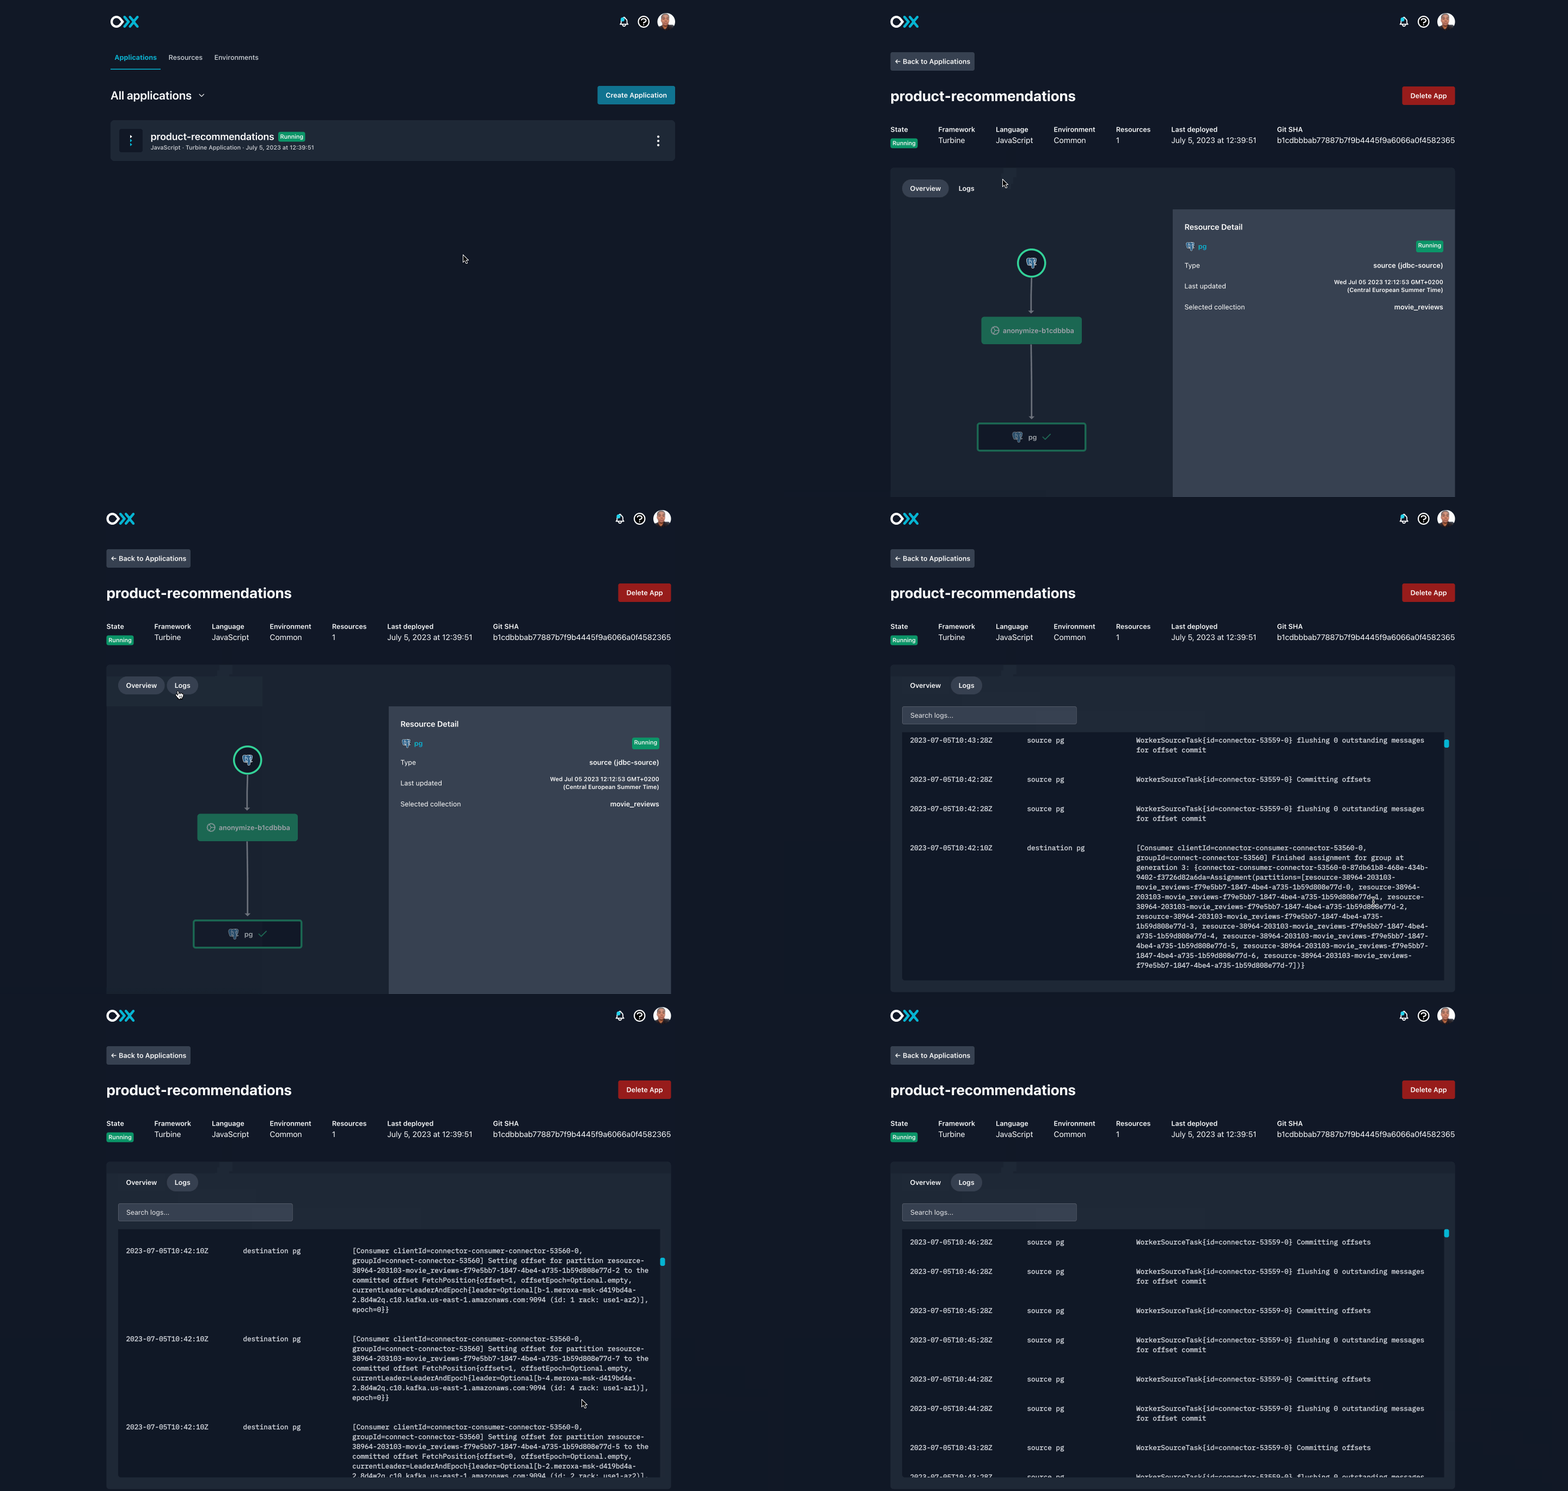
In order to debug your Turbine Data Applications on the Meroxa platform and monitor their activity, you can now not only inspect application logs from the CLI, but also from the Meroxa Dashboard.
To inspect application logs from the dashboard, visit the link displayed in your terminal after deploying your Turbine Data Application successfully via meroxa apps deploy. Alternatively, you can also visit the Application List page from your browser directly and select your deployment from the list.
Next, click Logs in the navigation menu to view the Application Logs page.

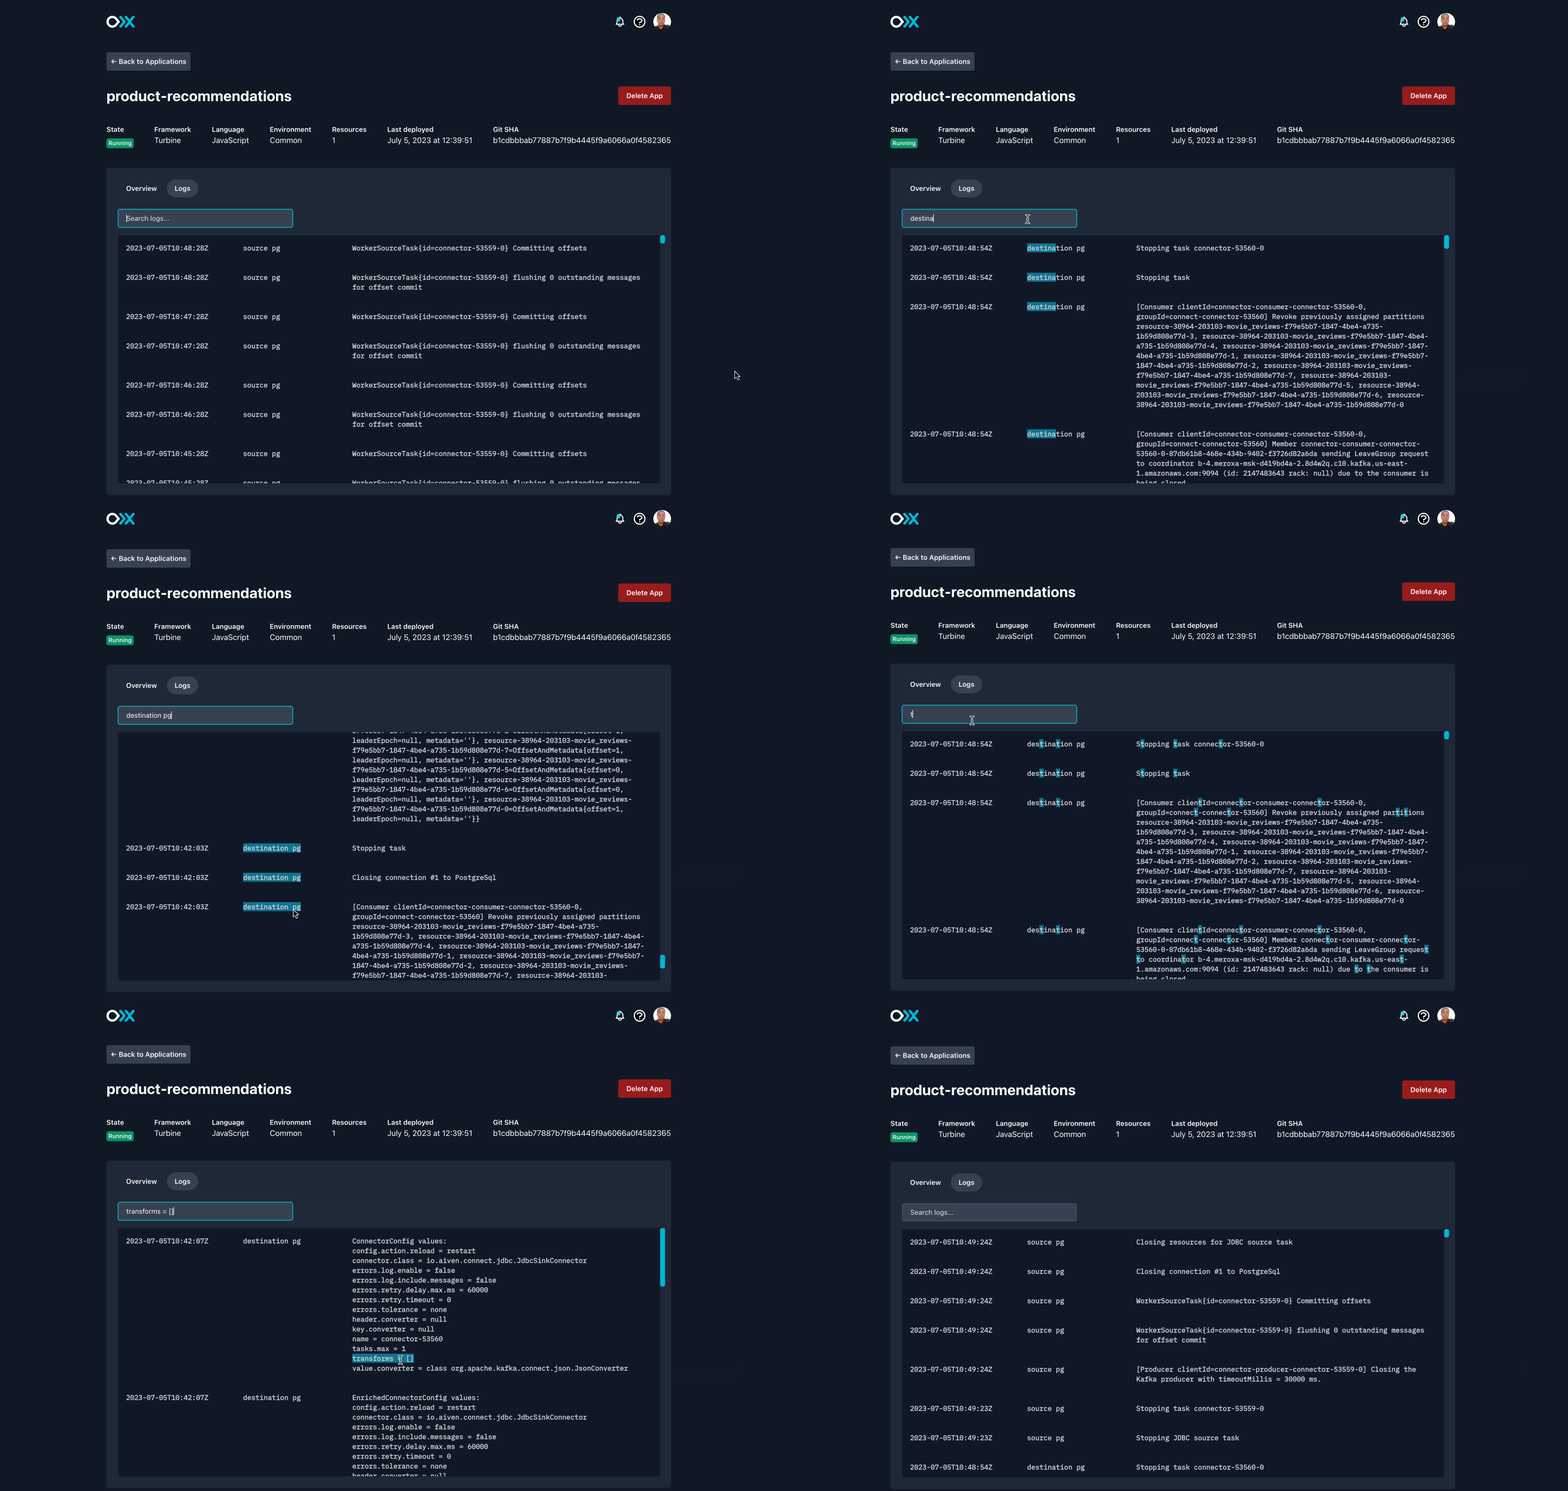
Filter all of your logs by source, destination and function names or any other keyword that you're expecting within your log output:

If you have feedback for us or additional questions on how to get started, feel free to join our Discord community or email us at [email protected]. We'd love to hear from you!
