Metrics in Datadog
Application metrics can be sent to Datadog, a third-party observability service for cloud-scale applications.
Prerequisites
- An existing Datadog account. If you don't have one, you can sign up for a new Datadog account.
- A valid Datadog Organization API key generated in your Datadog organization settings.
Getting started
You will need to have the Owner role to access the necessary platform settings.
- Log in to your Conduit Platform dashboard. e.g. https://company.na1.meroxa.net
- Click the user menu indicated by the user icon at the top right hand corner of your dashboard.
- Click Platform settings in the user menu.
- Click the Monitoring tab.
- Click the Configure button next to Datadog.
- Provide the Datadog Site and API Key in the corresponding configuration fields.
- Click the Save configuration button.
The platform will automatically validate your Datadog API key for you.
Datadog Sites
A Datadog site identifies which site your Datadog instance is accessed by. Here is a corresponding list of Datadog sites:
| Site | Site URL | Site Parameter | Location |
|---|---|---|---|
| US1 | https://app.datadoghq.com | datadoghq.com | US |
| US3 | https://us3.datadoghq.com | us3.datadoghq.com | US |
| US5 | https://us5.datadoghq.com | us5.datadoghq.com | US |
| EU1 | https://app.datadoghq.eu | datadoghq.eu | EU (Germany) |
| US1-FED | https://app.ddog-gov.com | ddog-gov.com | US |
| AP1 | https://ap1.datadoghq.com | ap1.datadoghq.com | Japan |
Refer to the Datadog documentation on accessing Datadog sites.
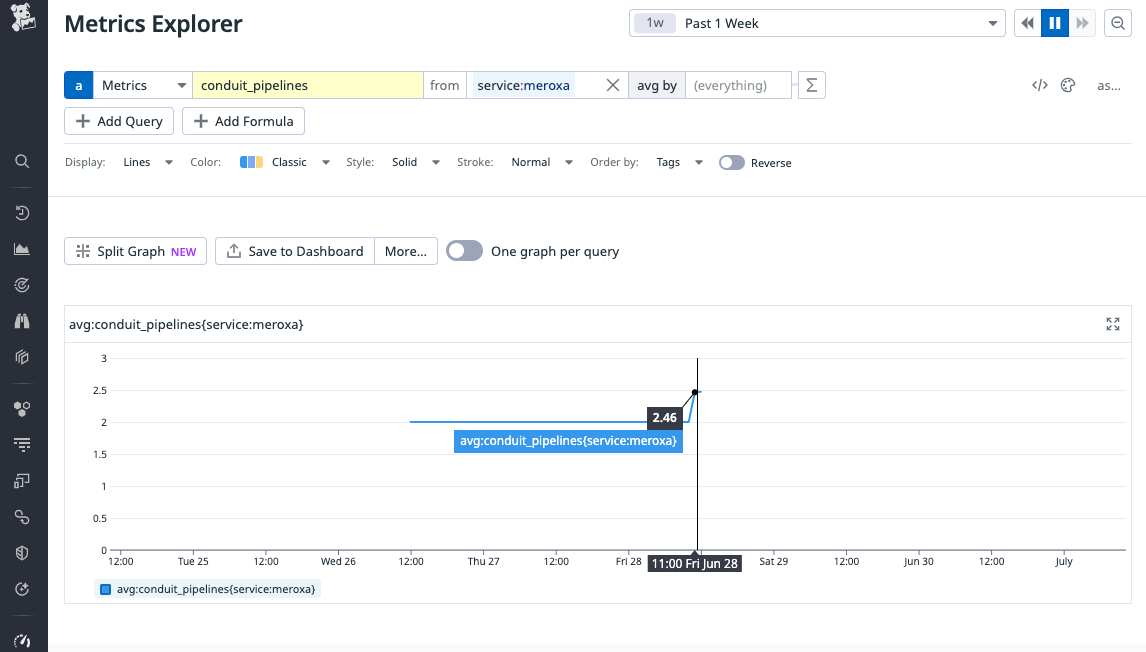
Application metrics in Datadog
To view your application metrics in Datadog, use the Metrics Explorer or include them in a Datadog dashboard. Filter your metrics by service:meroxa to search for the following supported metrics:
| Metric | Description | Type |
|---|---|---|
conduit_pipelines | Number of pipelines by status. | Gauge |
conduit_connectors | Number of connectors by type. | Gauge |
conduit_processors | Number of processors by name and type. | Gauge |
conduit_connector_bytes | Number of bytes a connector processed by pipeline name, plugin, and type. | Histogram |
conduit_pipeline_execution_duration_seconds | Amount of time records spent in a pipeline. | Histogram |
conduit_connector_execution_duration_seconds | Amount of time spent reading or writing records per pipeline, plugin and connector type. | Histogram |
conduit_processor_execution_duration_seconds | Amount of time spent on processing records per pipeline and processor. | Histogram |
Note: Type above refers to source or destination.
Monitoring Examples
Here are a few examples of timeseries widgets you might add to your internal Datadog dashboards to monitor application metrics.
Connectors Records Per Second
Measures connector records per second.
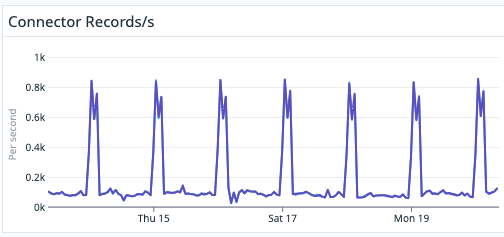
To get this timeseries, query metrics conduit_connector_bytes.count from service:meroxa and avg by pipeline_name as rate.
Connectors Bytes Per Second
Measures connector kilobytes per second.
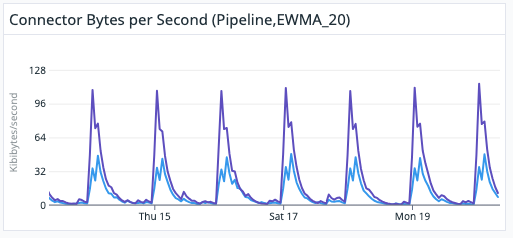
To get this timeseries, query metrics conduit_connector_bytes.sum from service:meroxa and sum by pipeline_name as count with formulas per_second and ewma_5.
Connectors Execution Duration By Pipeline
Measures connector execution duration time in milliseconds by pipeline
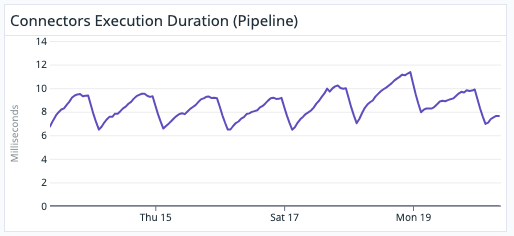
To get this timeseries, a query metrics conduit_connector_execution_duration_seconds.sum from service:meroxa and avg by pipeline_name.
And, b query metrics conduit_connector_execution_duration_seconds.count from service:meroxa and avg by pipeline_name.
And, add formula a / b with function ewma_20.
Pipeline Execution Duration
Measures pipeline execution duration time in minutes.
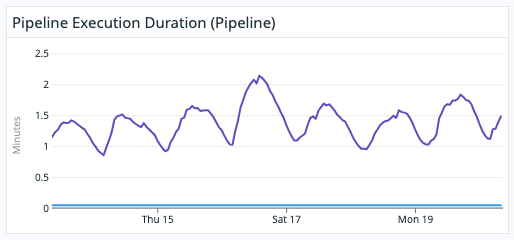
To get this timeseries, a query metrics conduit_pipeline_execution_duration_seconds.sum from service:meroxa and sum by pipeline_name as count.
And, b query metrics conduit_pipeline_execution_duration_seconds.count from service:meroxa and sum by pipeline_name as count.
And, add formula a / b with function ewma_20.
Need other metrics or assistance?
Need a metric that isn't available? Let us know. Contact us by email via [email protected] or join our Discord Community.